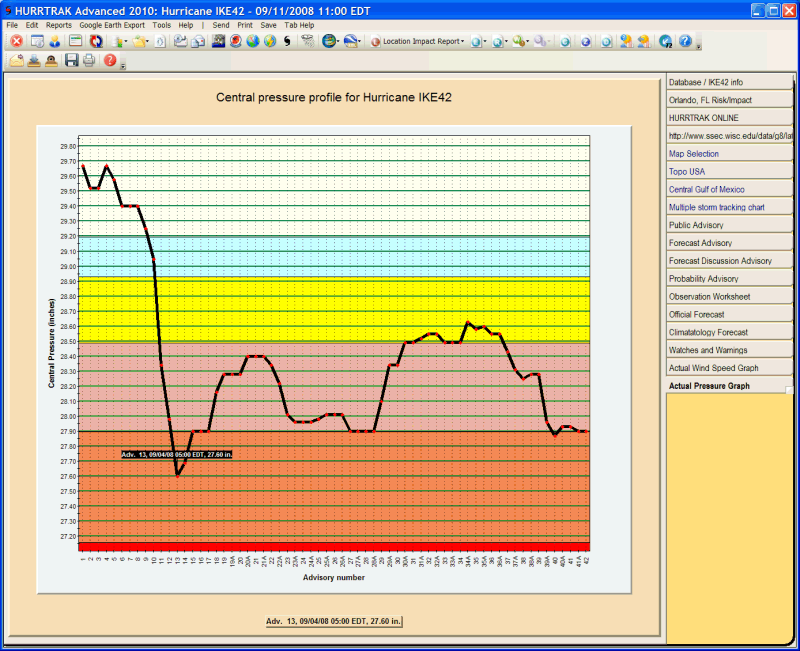
Central Pressure Graph Tab

Description: This tab displays the selected storm's central pressure graph. Each bar represents an observation point. The unit of measure, millibars or inches, is based on the UOM option for pressure.
Tab Created by: This tab is visible if there is more than one storm observation
Tab Close Allowed: No, however this tab can be deselected in General Options.
Functions Available:
Menu/Toolbar:
Standard System Menu Functions
Send (Email)- Allows the user to send the text, via Email, to another user.
Print Graph - Prints the graph.
Toolbars: See Appendix Section for more information.
Tips:
Pointing and clicking on an observation point will display the observations date, time and pressure data under the graph.