SLOSHView
Data Display (MEOW)

While
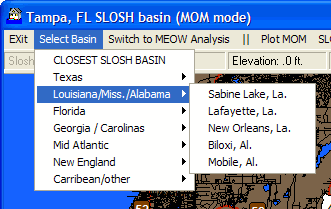
viewing SLOSH MEOW plots on a chart, there are several menu options available. They
include:
Exit
Select
Basin Switch
to MOM Analysis Plot
MEOW Undo
Reset
Image
Display
Annotate
Send
Print
Save
Image
SloshReport
(MEOW)
Options
Help
CLICK
on any of the above commands to learn more
In
MEOW mode an additional set of options is shown on the right side of the screen.
They include:
Storm
Motion Compass – Select
the direction in which the storm situation being analyzed is moving.. i.e. A storm
moving towards the NNE should have NNE selected.
Storm
Category –
Select the category of the storm situation being analyzed.
Storm
Speed/Tide –
Select the storm’s forward motion and tide (if available).
Command
buttons available:
Plot
MEOW SLOSH (raw) – This
matches the Plot MEOW menu command and is put on the right side panel for convenience
Plot
MEOW Inundation – This
matches the Plot MEOW menu command and is put on the right side panel for convenience
Export
MEOW SLOSH Polygons to Google Earth - This
matches the Plot MEOW menu command and is put on the right side panel for convenience
Finally,
by checking the “Close this Window…” option in the upper right hand
portion of the panel, the right side panel will be hidden when doing the analysis.
Selecting RESET Image will unhide the panel so that the user can select different
analysis options.
After
plotting SLOSH, you can zoom in by “rubber banding” an area with your mouse
(left button) or by selecting zoom in or zoom out.
The SLOSH information will re-plot at your new zoom level.
In
addition, when plotting a MOM the following mouse actions will display the following
information.
Left
Click + Shift – Displays
the raw SLOSH value
Right
Click – Displays
the Inundation level
Right
Click + Shift – Places
the “house” icon at the position of your cursor

